

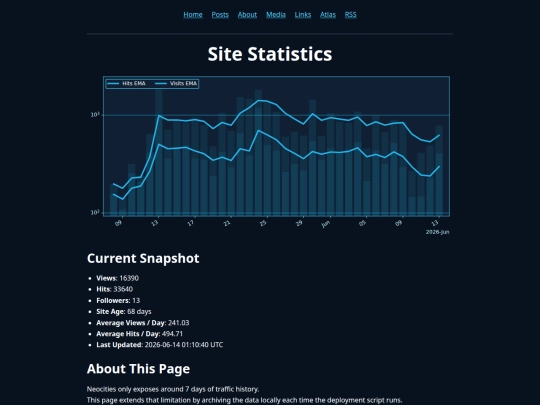


The May 13 traffic spike was ruining the readability of my analytics graph, so I rewrote the visualization logic and switched to logarithmic scaling + EMA smoothing. Looks much cleaner now ^_^


I wanna join as well here's my RSS: https://frostecho.yorniq.xyz/index.xml
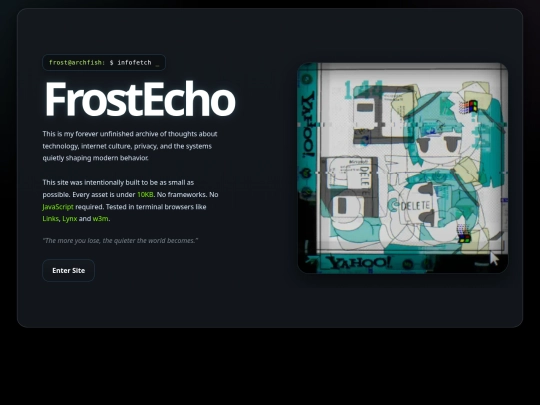
My buttons are here, choose whichever you like the best: https://frostecho.yorniq.xyz/links/
Great idea BTW I'd like to see more and more sites added to this list 😃
1 like


I'm sorry as this is a bit annoying, but I didn't like my old buttons and furthermore they were SVGs instead to the usual PNG or GIFs that every single site I see uses. It took me sometime but I was able to use python to finnally get what I wanted.
So please replace the old button on your website with one of the new ones I created. 😔
1 like


I was wondering why did my site attract so many visitors on 13th. It seems I found my answer: https://news.ycombinator.com/item?id=48117040
It's nice to see others take interest interact with your work 😁
Added a stats page to monitor my website's progress over time, at: https://frostecho.yorniq.xyz/stats/
1 like

1 like


okay! done :)
Thanks